BMI Chart
This BMI Chart or BMI Table displays what category each BMI falls under and shows it in Table format.
The formula used to calculate BMI can be found here: BMI Formula.
How to view your BMI from the Chart
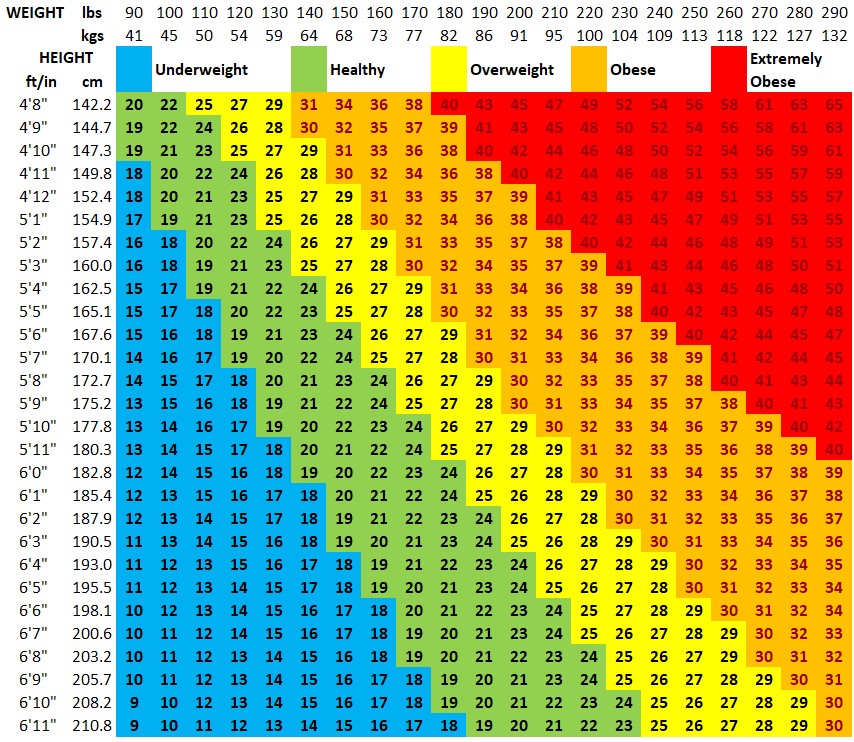
To view where your BMI lies in this chart, you can first find your weight on the top horizontal axis and then following the BMI numbers all the way down until the height on the left axis corresponds to your height. The category that your body mass index (BMI) lies under is shaded in the corresponding color which is shown in the legend above as well list below:
- Blue: The category is Underweight and corresponds to a BMI of less than 18.5
- Green: The category is Normal Weight and corresponds to a BMI between 18.5 and 24.9
- Yellow: The category is Overweight and corresponds to a BMI between 25 and 29.9
- Orange: The category is Obese and corresponds to a BMI between 30 and 39.9
- Red: The category is Extremely Obese and corresponds to a BMI of 40 or higher
Important Notes
The BMI Chart gives the advantage of visually seeing what is the required weight (or height) that needs to be changed in order to jump from one bodyweight category to another. That being said, the body mass index is still to be used along with many other health measures such as lifestyle, fitness, and overall physical happiness. The BMI is not a perfect measure so it is important to ask yourself (and doctor) for possible reasons for your BMI reading to decide if it is due actually having or not having a healthy body weight. A full decision on the advantages and limitations of the body mass index are shown in our BMI Calculator so make sure to read those fully!